Market overview
It was a challenging quarter for the broader market as prolonged period of generally declining volatility ended abruptly in February 2018. Equities, credit, mortgage backed securities, treasury bonds, and the US dollar all saw negative performance for the quarter.
US equities began 2018 strongly as a result of ongoing strength in economic data, robust earnings and the confirmation of a major tax reform package. However, gains reversed in the latter part of the quarter and major stock indices headed south amid concerns over elevated US inflation prints and increased risk of the US-China trade war. Overall, the S&P 500 plunged by 1.22% in the period.
European equities underperformed for the quarter (-3.42%), with all sectors posting declines. Political uncertainty in Germany and Italy and signs of slowing growth weighed on investor sentiment. Extreme levels of volatility in global markets, concerns about the potential global trade war, and anxiety about the prospect of increased regulatory scrutiny in the technology sector negatively impacted equities.
Japanese equities followed a similar pattern to other global markets and ended the quarter 4.7% lower. Potential trade disruptions affected the trade related sectors most while domestically orientated sectors performed quite well.
Asia ex Japan equities managed to finish the quarter in positive territory, though were not immune from the rise in volatility linked to global trade concerns. Thailand, Taiwan and Malaysia were among the best performing markets. Backed by the more resilient than expected macroeconomic data, Chinese equities posted solid gains as well. On the other hand, the Philippines and Indonesia fell sharply. India also lagged as the result of the domestic political and global macro (higher commodities prices, tightening interest rates) headwinds.
To sum up, now that long awaited volatility is back and fiercer than it’s been in years, hedge funds have a perfect opportunity to prove themselves. If they manage to capitalize on the current situation, investors’ perception towards the industry could improve significantly.
Inflows and launches
The spike in volatility hasn’t stopped investors from allocating additional funds to the hedge funds’ industry. This was the fourth consecutive quarter with the positive fund flows and marks weigh more positive start of 2018 compared the first quarter of 2017, when funds experienced net outflows of $5.6 billion. The reallocation of funds among different strategies might be a sign of investors seeking the real hedge by reducing their exposure to equity market beta funds.
According to the latest HFR Global Hedge Fund Industry Report, net inflows for the quarter totaled $1.1 billion. Among the strategies, Event Driven funds were clear winners attracting net inflows of $4.4 billion as investors rushed towards M&A, Activist and credit-sensitive strategies. Relative Value strategies also enjoyed inflows in 1Q18, attracting $2.3 billion of new capital. The strategy experienced net outflows of $5.6 billion in 2017 but might fully recover in the near future if the volatility is here to stay for a longer time. Macro hedge funds posted inflows of $909 million. Investors rotated out of fundamental Discretionary Thematic (-$1.8 billion), Commodity (-$1.3 billion) and Multi-Strategy (-$1.2 billion) into quantitative, trend-following CTA strategies. Equity Hedge funds saw outflows of $6.57 billion. Despite this, it remains the industry's largest strategy. Equity Market Neutral and Quantitative Directional funds attracted additional interest, however, this was not enough to offset outflows from Fundamental Value led EH sub-strategy.
1 picture. Quarterly net inflows by strategy, in billion USD
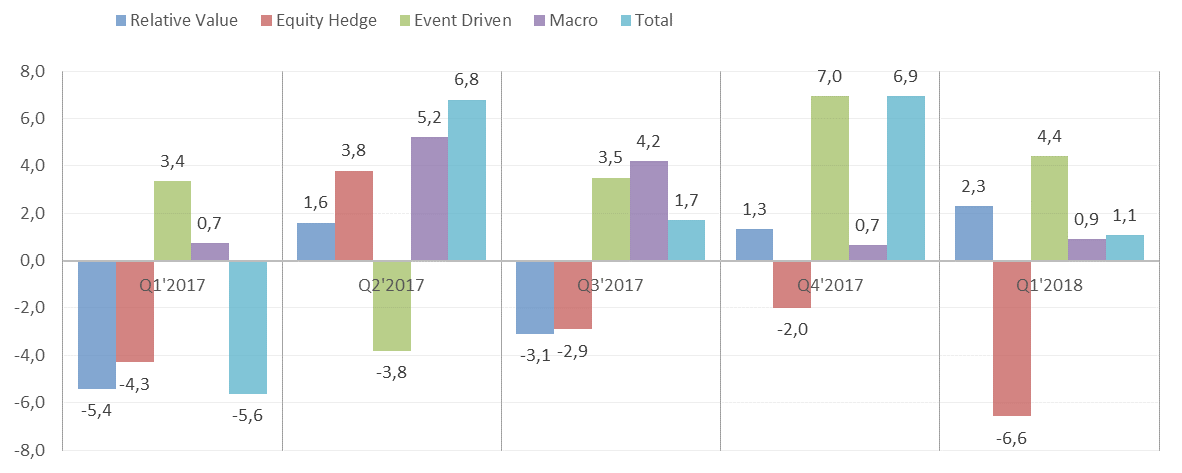
Source: HFR
Another interesting trend is related to fund size. Investors favored smaller funds with less than $1 billion in AUM. The capital reduction among firms managing between $1 and $5 billion experienced the largest outflows while firms with AUM above $5 billion also contracted but at the modest pace. To sum up, it is clear that investors are positioning themselves in a more defensive way, avoiding large and crowded high equity beta funds and leaning towards smaller niche firms.
Hedge funds performance
The beginning of 2018 had no signs of upcoming turbulence in the equity markets, affecting all other markets including the hedge funds industry. The later clinched its 15th consecutive month of positive performance in January gaining +2.34%. However, the majority of hedge funds were unable to capitalize on increased market volatility and experienced two consecutive months of aggregate declines finishing the quarter up by just 0.14% on average.
1 table. Quarterly performance of MC Investments’ selected funds and HFRI Indices
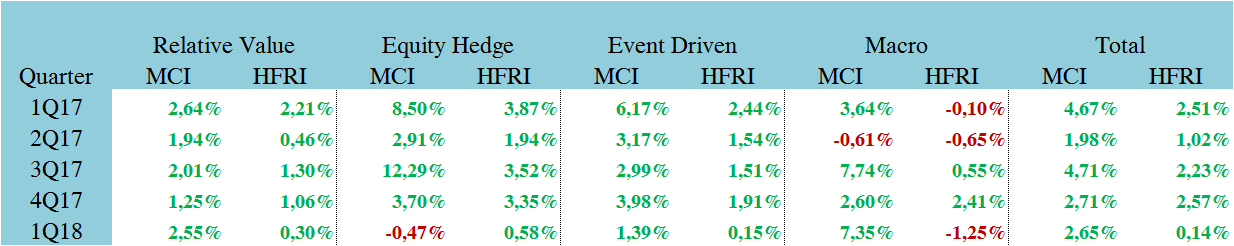
Source: HFRI Indices, MC Investments’ calculations
Among the strategies, the worst quarterly performance was recorded by Macro funds which were down by 1.25% in Q1. The remaining strategies delivered somewhat weak results as well. For instance, the best performing Equity Hedge strategy was up by just 0.58%. MC Investments’ selected funds delivered opposite to the industry results. Our Equity hedge funds were slightly down (-0.47%) while Macro funds had an exceptional quarter returning 7.35%. Relative value and Event Driven strategies did well advancing 2.55% and 1.39% respectively. The total gain for the quarter was 2.65% versus the industry’s 0.14%.
As the chart below shows, our portfolio delivered excess returns over the HFRI Index in each quarter starting 2017. On the strategy level, there was only one quarter when our Equity Hedge funds underperformed the HFRI Equity Hedge Index. All other strategies managed to outperform their comparable HFRI indices in 5 consecutive quarters.
2 picture. Excess returns of MC Investments’ selected funds over HFRI Indices, in percentage points
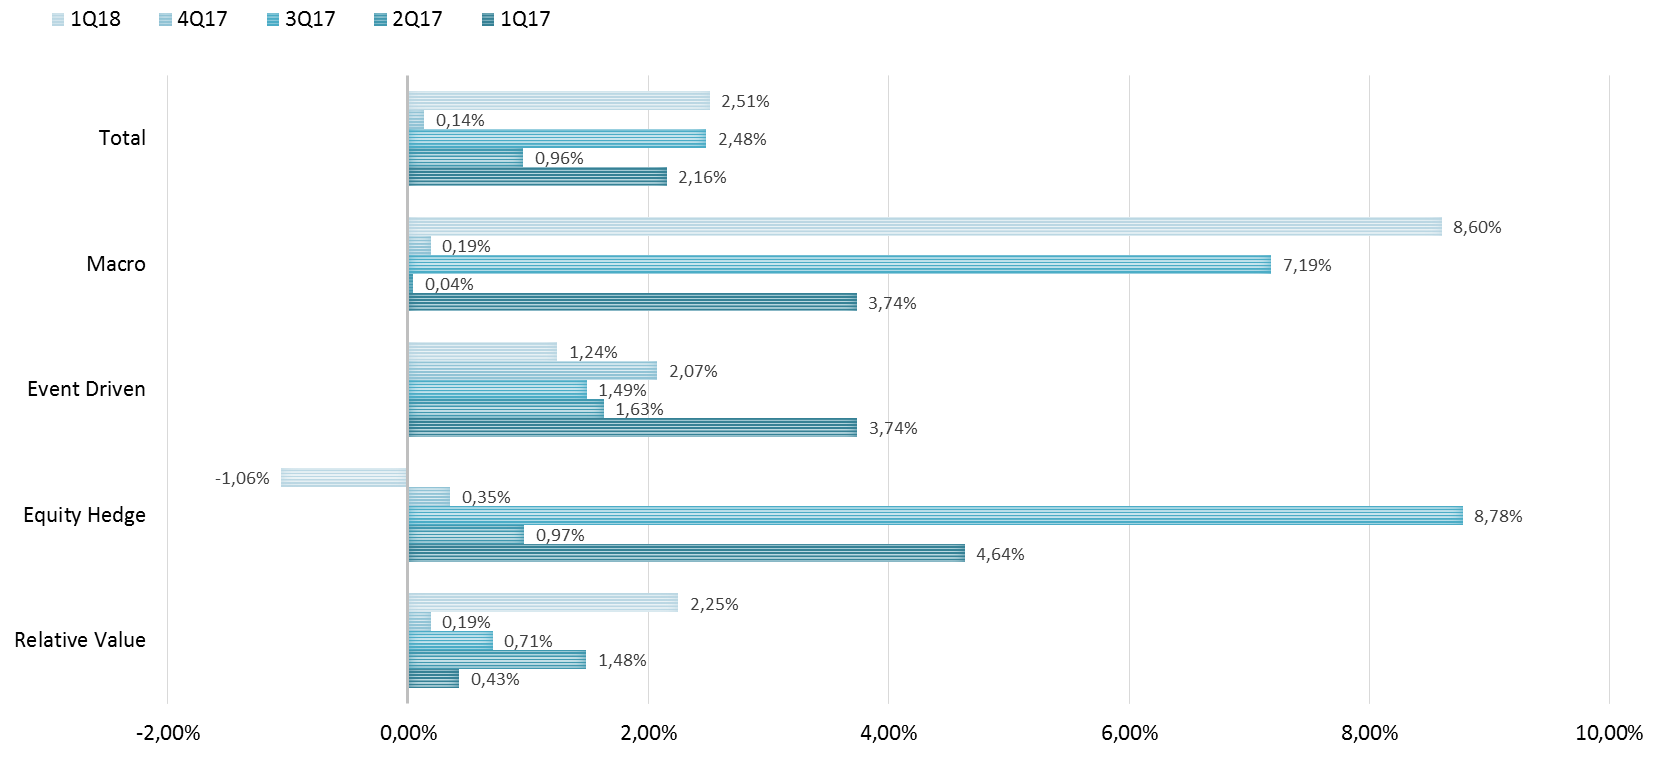
Source: HFRI Indices, MC Investments’ calculations
Since the beginning of 2017 MC Investments’ portfolio has returned 17.83%, twice as much as the HFRI Index. It should be noted that he right allocation among strategies plays an important role as well. For example, we avoid high exposure to the Equity Hedge funds dedicating them the smallest part in our portfolio (14%). This assures lower volatility in the periods like last February and March. Adjusted by our portfolio weighs, the HFRI Index would have generated additional 1.65 p.p.
3 picture. Cumulative returns of HFRI Index and MC Investments’ portfolio since the beginning of 2017
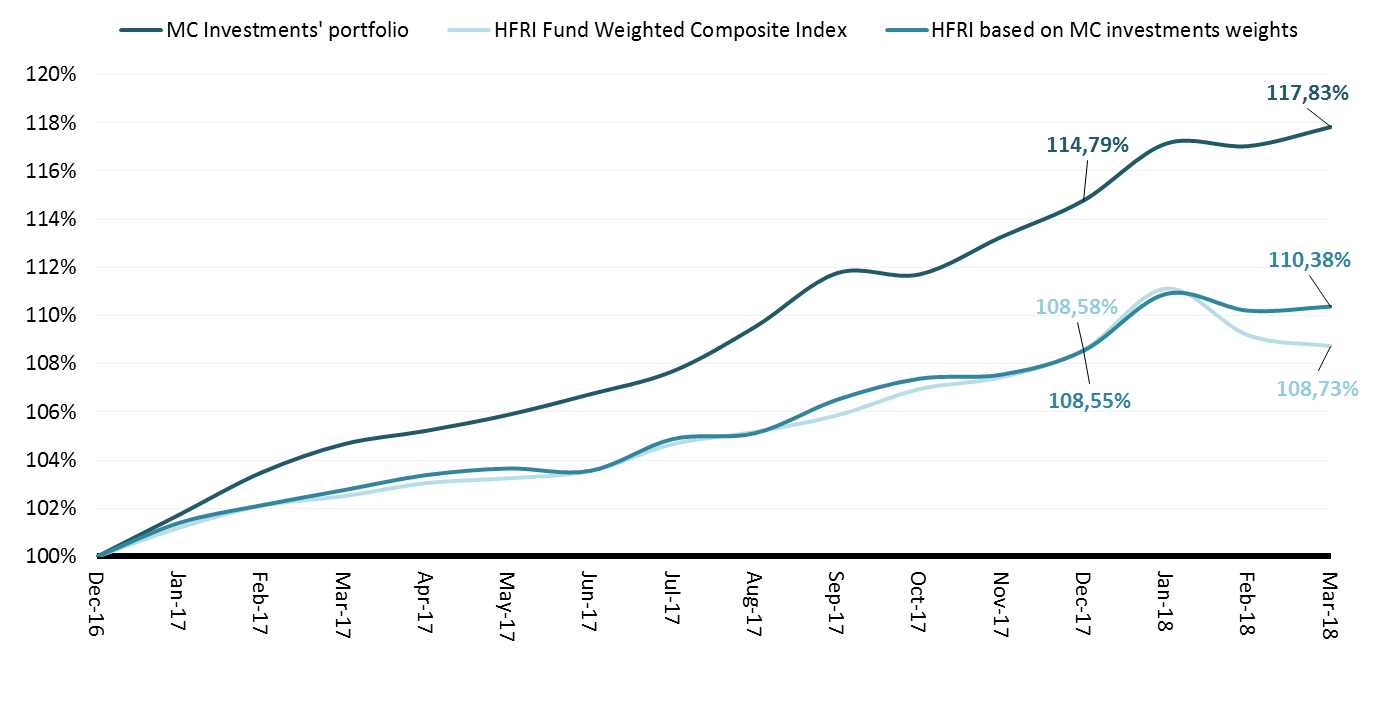
Source: HFRI Indices, MC Investments
Our Top pick
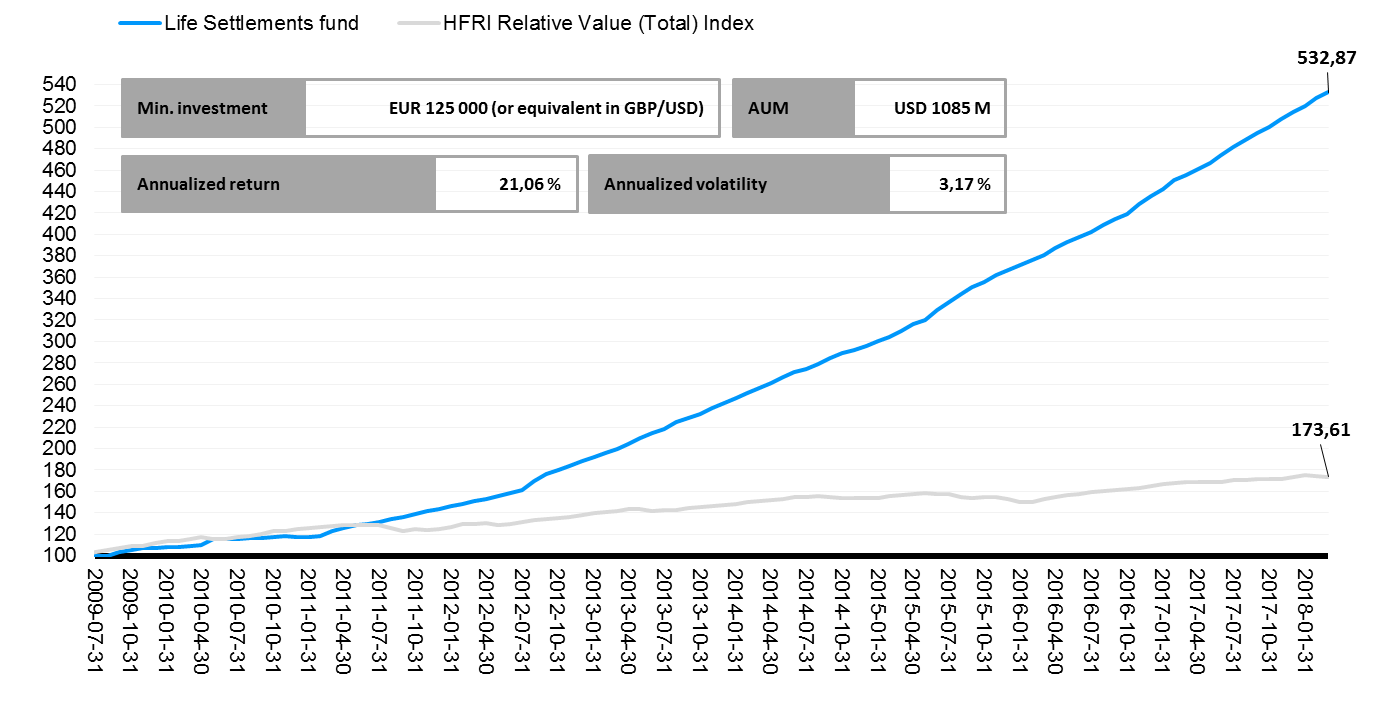
Our selected life settlement fund deserves to be named the Top Pick fund again as Life Settlements industry has proved to be resistant to changes in global geo-political and economic environments, while simultaneously benefiting from the changes to the regulatory framework in US as well as shifts in investor’s demands. The fund posted 3.68% returns in Q1 and outperformed a comparable HFRI Relative Value Index by 3.38 p.p. margin. The Fund demonstrates continued stability with the annualized standard deviation of 3.17% since inception and makes us confident in its capacity to deliver sustainable uncorrelated returns.
Don't hesitate to get in touch should you wish to learn more about the Fund.
4 picture. The performance of Top pick fund vs. HFRI Relative Value Index since fund’s inception
Source: HFRI Indices, MC Investments’ calculations
Articles you might be interested in
Equity Hedge Funds Must ‘Put Up or Shut Up’ With Market Volatility
The Crypto Hedge-Fund Bubble Is Starting to Deflate
Quant Style Slump That Strategists Foretold Finally Arrives
Morgan Stanley says the stock market melt-up is over
Saxo Bank’s Q2 2018 Quarterly Outlook
These hedge fund numbers can't be right
Last commodities hedge funds go off beaten track
Mifid II forces fund managers into sharp research cuts
Indicators that signal financial-market trouble are flashing